
- Article Title Analysis: The title "Feedback Boards Analytics" directly indicates the article's focus on analyzing data from feedback boards. It promises insights into how users interact with and respond to the content or features presented on these boards.
- Article Description Analysis: The description elaborates that the analytics tool, FeatureOS, provides insights into customer interactions with product ideas on various boards, offering both a broad overview (Global Analytics) and specific insights (Board-Specific Analytics) for product planning, prioritization, and engagement tracking.
- Global Analytics: Provides an overview of feedback across the entire organization, including weekly submissions, top keywords (AI-powered), post sentiment (AI), top performers, popular boards, post status distribution, status turnaround time (TAT) distribution, assignee distribution, top contributors, activity traffic, due posts, top-voted posts, stale posts, overdue posts, and votes count over time.
- Board-Specific Analytics: Focuses on a single board, providing insights specific to that product area, feature category, or functional domain, including top keywords (AI-Powered), Post Sentiment (AI), Top Performers, Post Status Distribution, Status TAT (Turnaround Time) Distribution, Assignee Distribution, Due Posts, Top Voted Posts, Stale Posts, Overdue Posts, and Votes Count Over Time.
- Global Analytics Use Cases: Suitable for understanding overall customer activity, preparing executive-level reports, and tracking overall engagement trends.
- Board-Specific Analytics Use Cases: Ideal for evaluating feedback for a specific product area and prioritizing ideas within one board.
Feedback Boards Analytics in FeatureOS helps you understand how customers interact with your product ideas across all boards and individual boards. With two levels of insights that is Global Analytics and Board-Specific Analytics, you get both the big picture and focused insights needed for product planning, prioritization, and engagement tracking.
Global Analytics (All Boards Combined)
Global Analytics gives you a complete overview of feedback activity across your entire organization. If you want to understand overall customer participation, trending themes, or the total volume of feedback coming in, this is the dashboard you’ll use most.
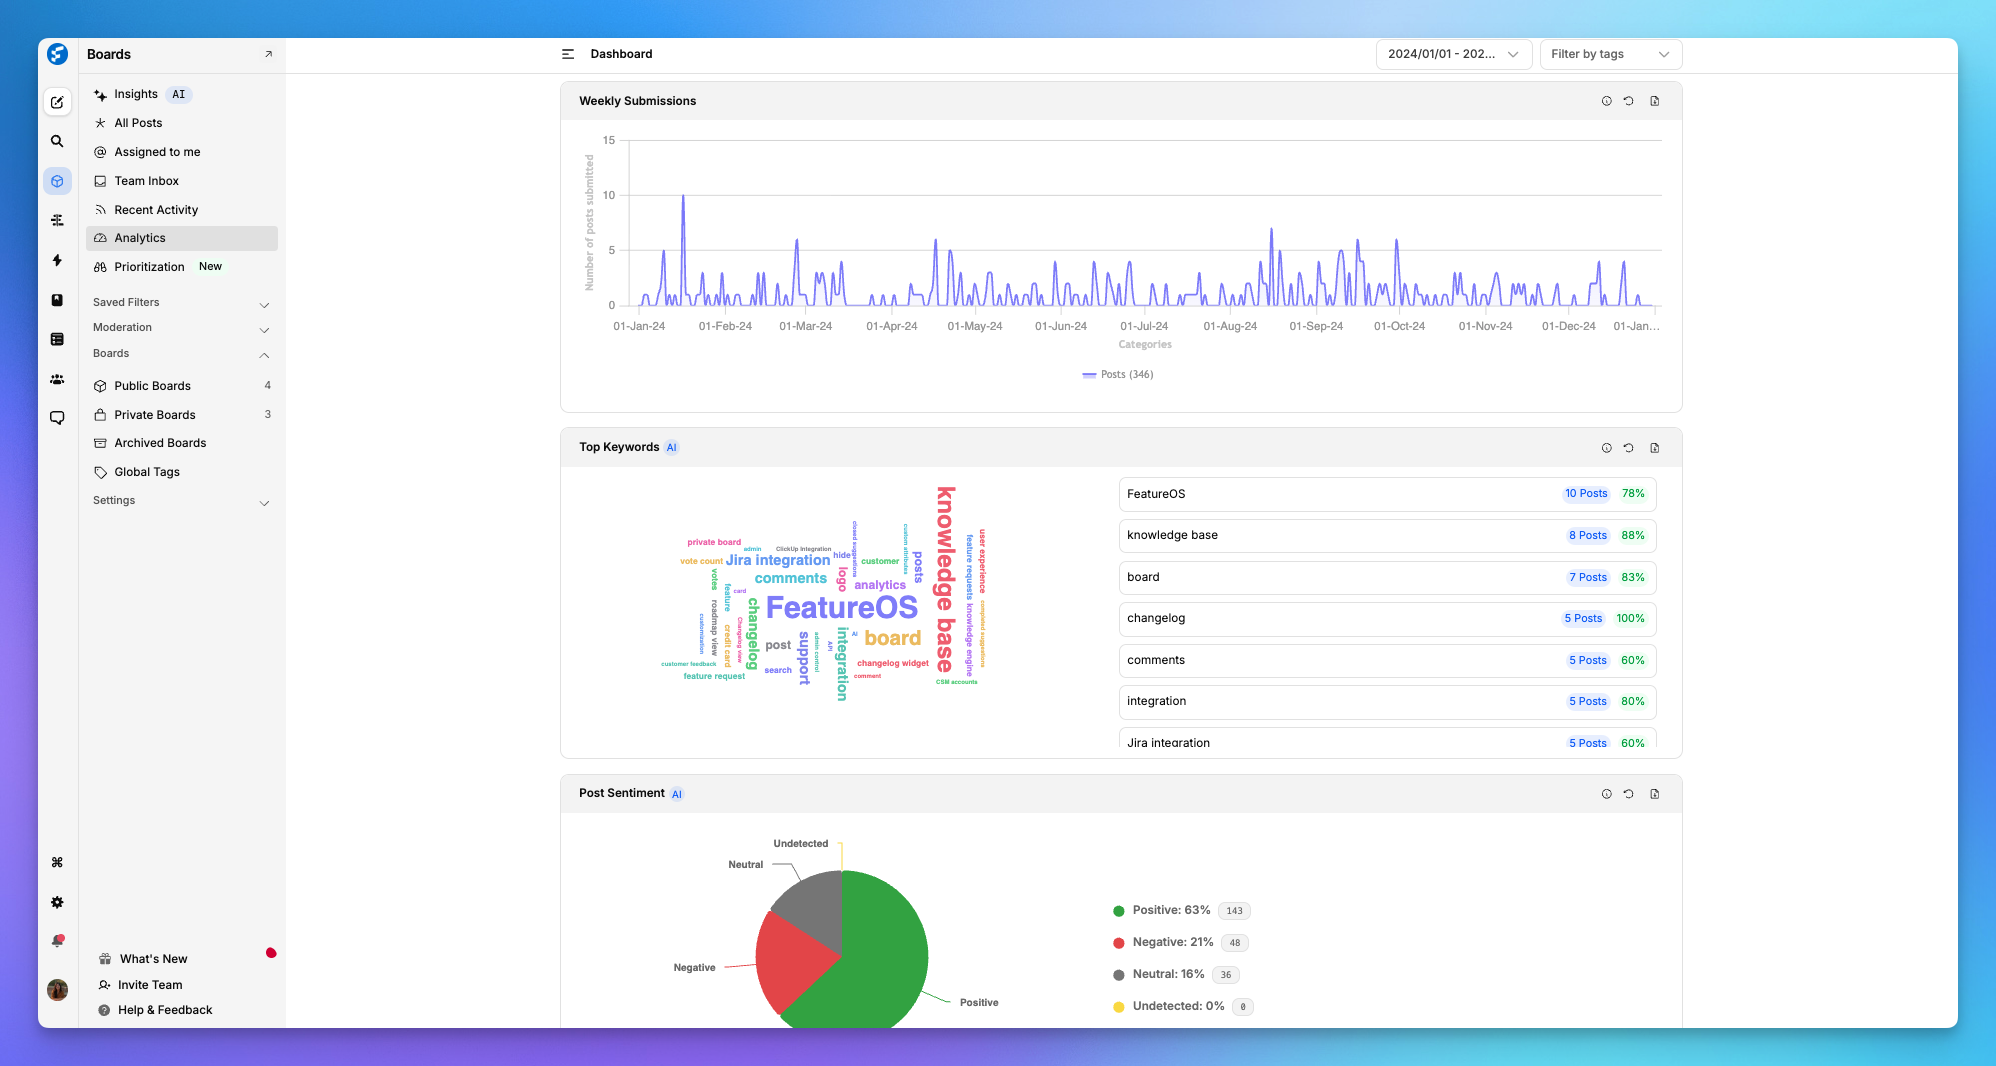
What Global Analytics Includes
Weekly Submissions :This chart shows the number of posts submitted across all boards over the selected date range. It helps your team track customer engagement trends over weeks or months.
Top Keywords (AI-Powered): This widget displays the most frequently used keywords found in posts across all boards. Use this to spot emerging themes, repeated requests, or rising problem areas.
Post Sentiment (AI): AI sentiment analysis helps you understand the emotional tone of your feedback.
Posts are categorized into: Positive, Negative, Neutral, Undetected. This helps you quickly gauge overall customer sentiment related to your product.Top Performers: This section ranks users who’ve contributed the most posts across all boards. Engage with these users for deeper insights or beta testing.
Popular Boards: A distribution chart showing which boards receive the most activity. This highlights modules your customers care about most or need your most attention to.
Post Status Distribution: This shows how all posts across your organization are currently categorized: In Review, In Progress, Planned, Completed, Closed.
Status TAT (Turnaround Time) Distribution: Understand how long posts typically remain in a given status. A key tool for internal process improvement.
Assignee Distribution: Visualizes how posts are assigned across your team: Shows each team member’s assigned posts, Includes “Unassigned” posts, Helps workload balancing, Ideal for assessing team ownership and distribution.
Top Contributors: This widget highlights which users (customers or team members) interact most with feedback.
Activity Traffic: A timeline of activity events across all boards. Use this to understand overall engagement momentum.
Due Posts: Shows posts that require action from your team based on due dates set internally. Helpful for ensuring nothing slips through the cracks.
Top Voted Posts: A list of posts that have received the highest number of votes across all boards.
Stale Posts: This highlights posts that have had no activity for the selected date range.
Overdue Posts: Shows posts that have missed internal deadlines or actions.
Votes Count Over Time: A timeline showing total vote activity across all boards. Votes help identify feature popularity and urgency.
Board-Specific Analytics (Individual Boards)
Board-Specific Analytics focuses on a single board. This is crucial when you want to understand feedback within a specific product area, feature category, or functional domain.
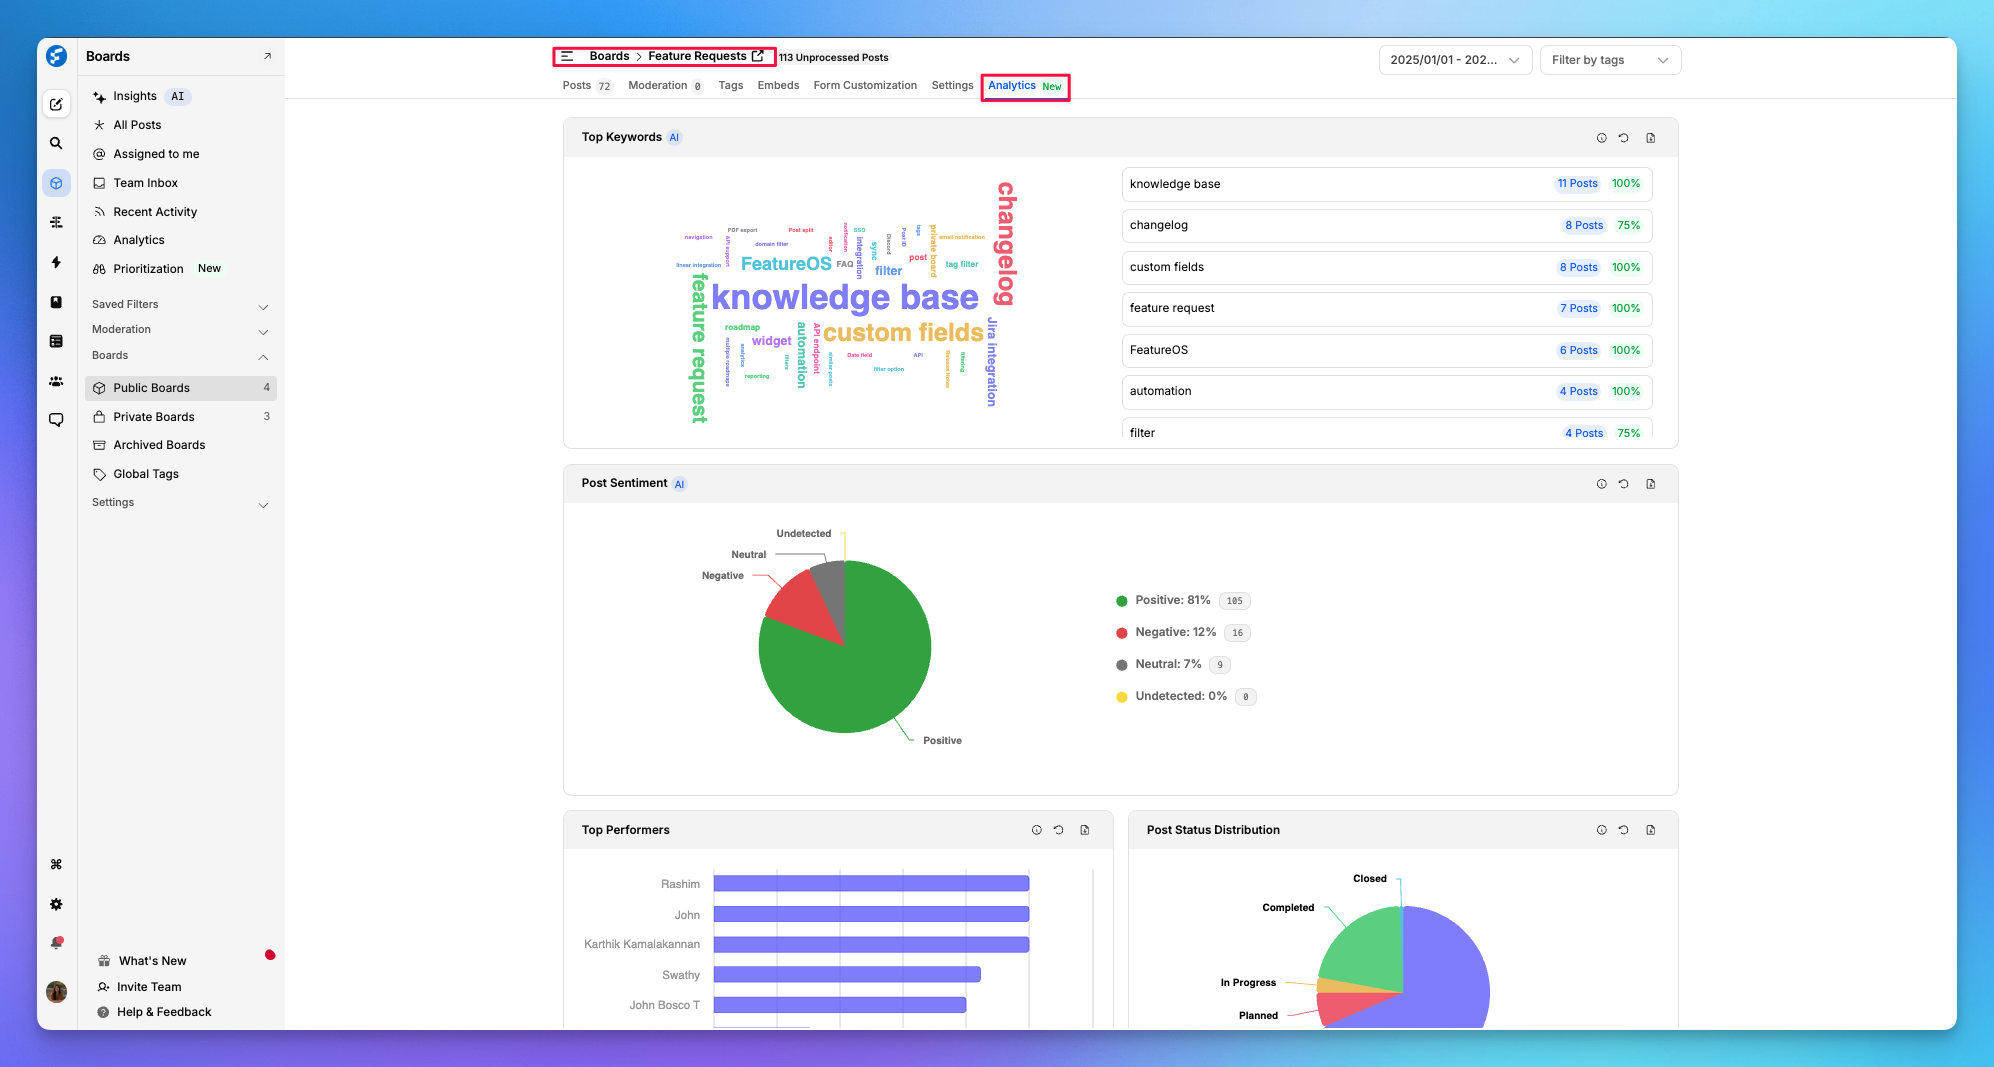
What Board-Specific Analytics Includes
Top Keywords (AI-Powered): This section shows the most common keywords used across posts within this board. This helps you instantly identify common themes, repeated requests, or emerging needs related to that specific board.
Post Sentiment (AI): AI sentiment analysis helps you understand the emotional tone of your feedback.
Posts are categorized into: Positive, Negative, Neutral, Undetected. Helpful for understanding customer emotion tied to this specific area of your product, especially if sentiment suddenly shifts after a release.Top Performers: Displays users who have submitted the highest number of posts in this board alone. A great tool for identifying customers to involve in beta testing or product interviews.
Post Status Distribution: This shows how all posts across your organization are currently categorized: In Review, In Progress, Planned, Completed, Closed.
Status TAT (Turnaround Time) Distribution: Shows how long posts typically stay in each status before progressing. This is particularly helpful for product operations and customer success teams.
Assignee Distribution: Displays how posts in this board are assigned across your team. Use this to maintain healthy workload balance and ensure no posts are left unattended.
Due Posts: Shows posts that require action from your team based on due dates set internally. Helpful for ensuring nothing slips through the cracks.
Top Voted Posts: A list of posts that have received the highest number of votes across all boards.
Stale Posts: This highlights posts that have had no activity for the selected date range.
Overdue Posts: Shows posts that have missed internal deadlines or actions.
Votes Count Over Time: A timeline showing total vote activity across all boards. Votes help identify feature popularity and urgenc
Global vs. Board-Specific Analytics: When to Use What
Use Case | Choose |
|---|---|
Want to see how active your entire customer base is | Global Analytics |
Need to evaluate feedback for one specific product area | Board-Specific Analytics |
Preparing executive-level reports | Global Analytics |
Planning backlog or sprints for a single feature | Board-Specific Analytics |
Tracking overall engagement trends | Global Analytics |
Prioritizing ideas within one board | Board-Specific Analytics |
Was this helpful?