
FeatureOS Changelog comes with analytics to help you understand how your product updates are being received. Instead of guessing, you can see exactly which updates your users read, how they interact, and what platforms they use.
Key Metrics
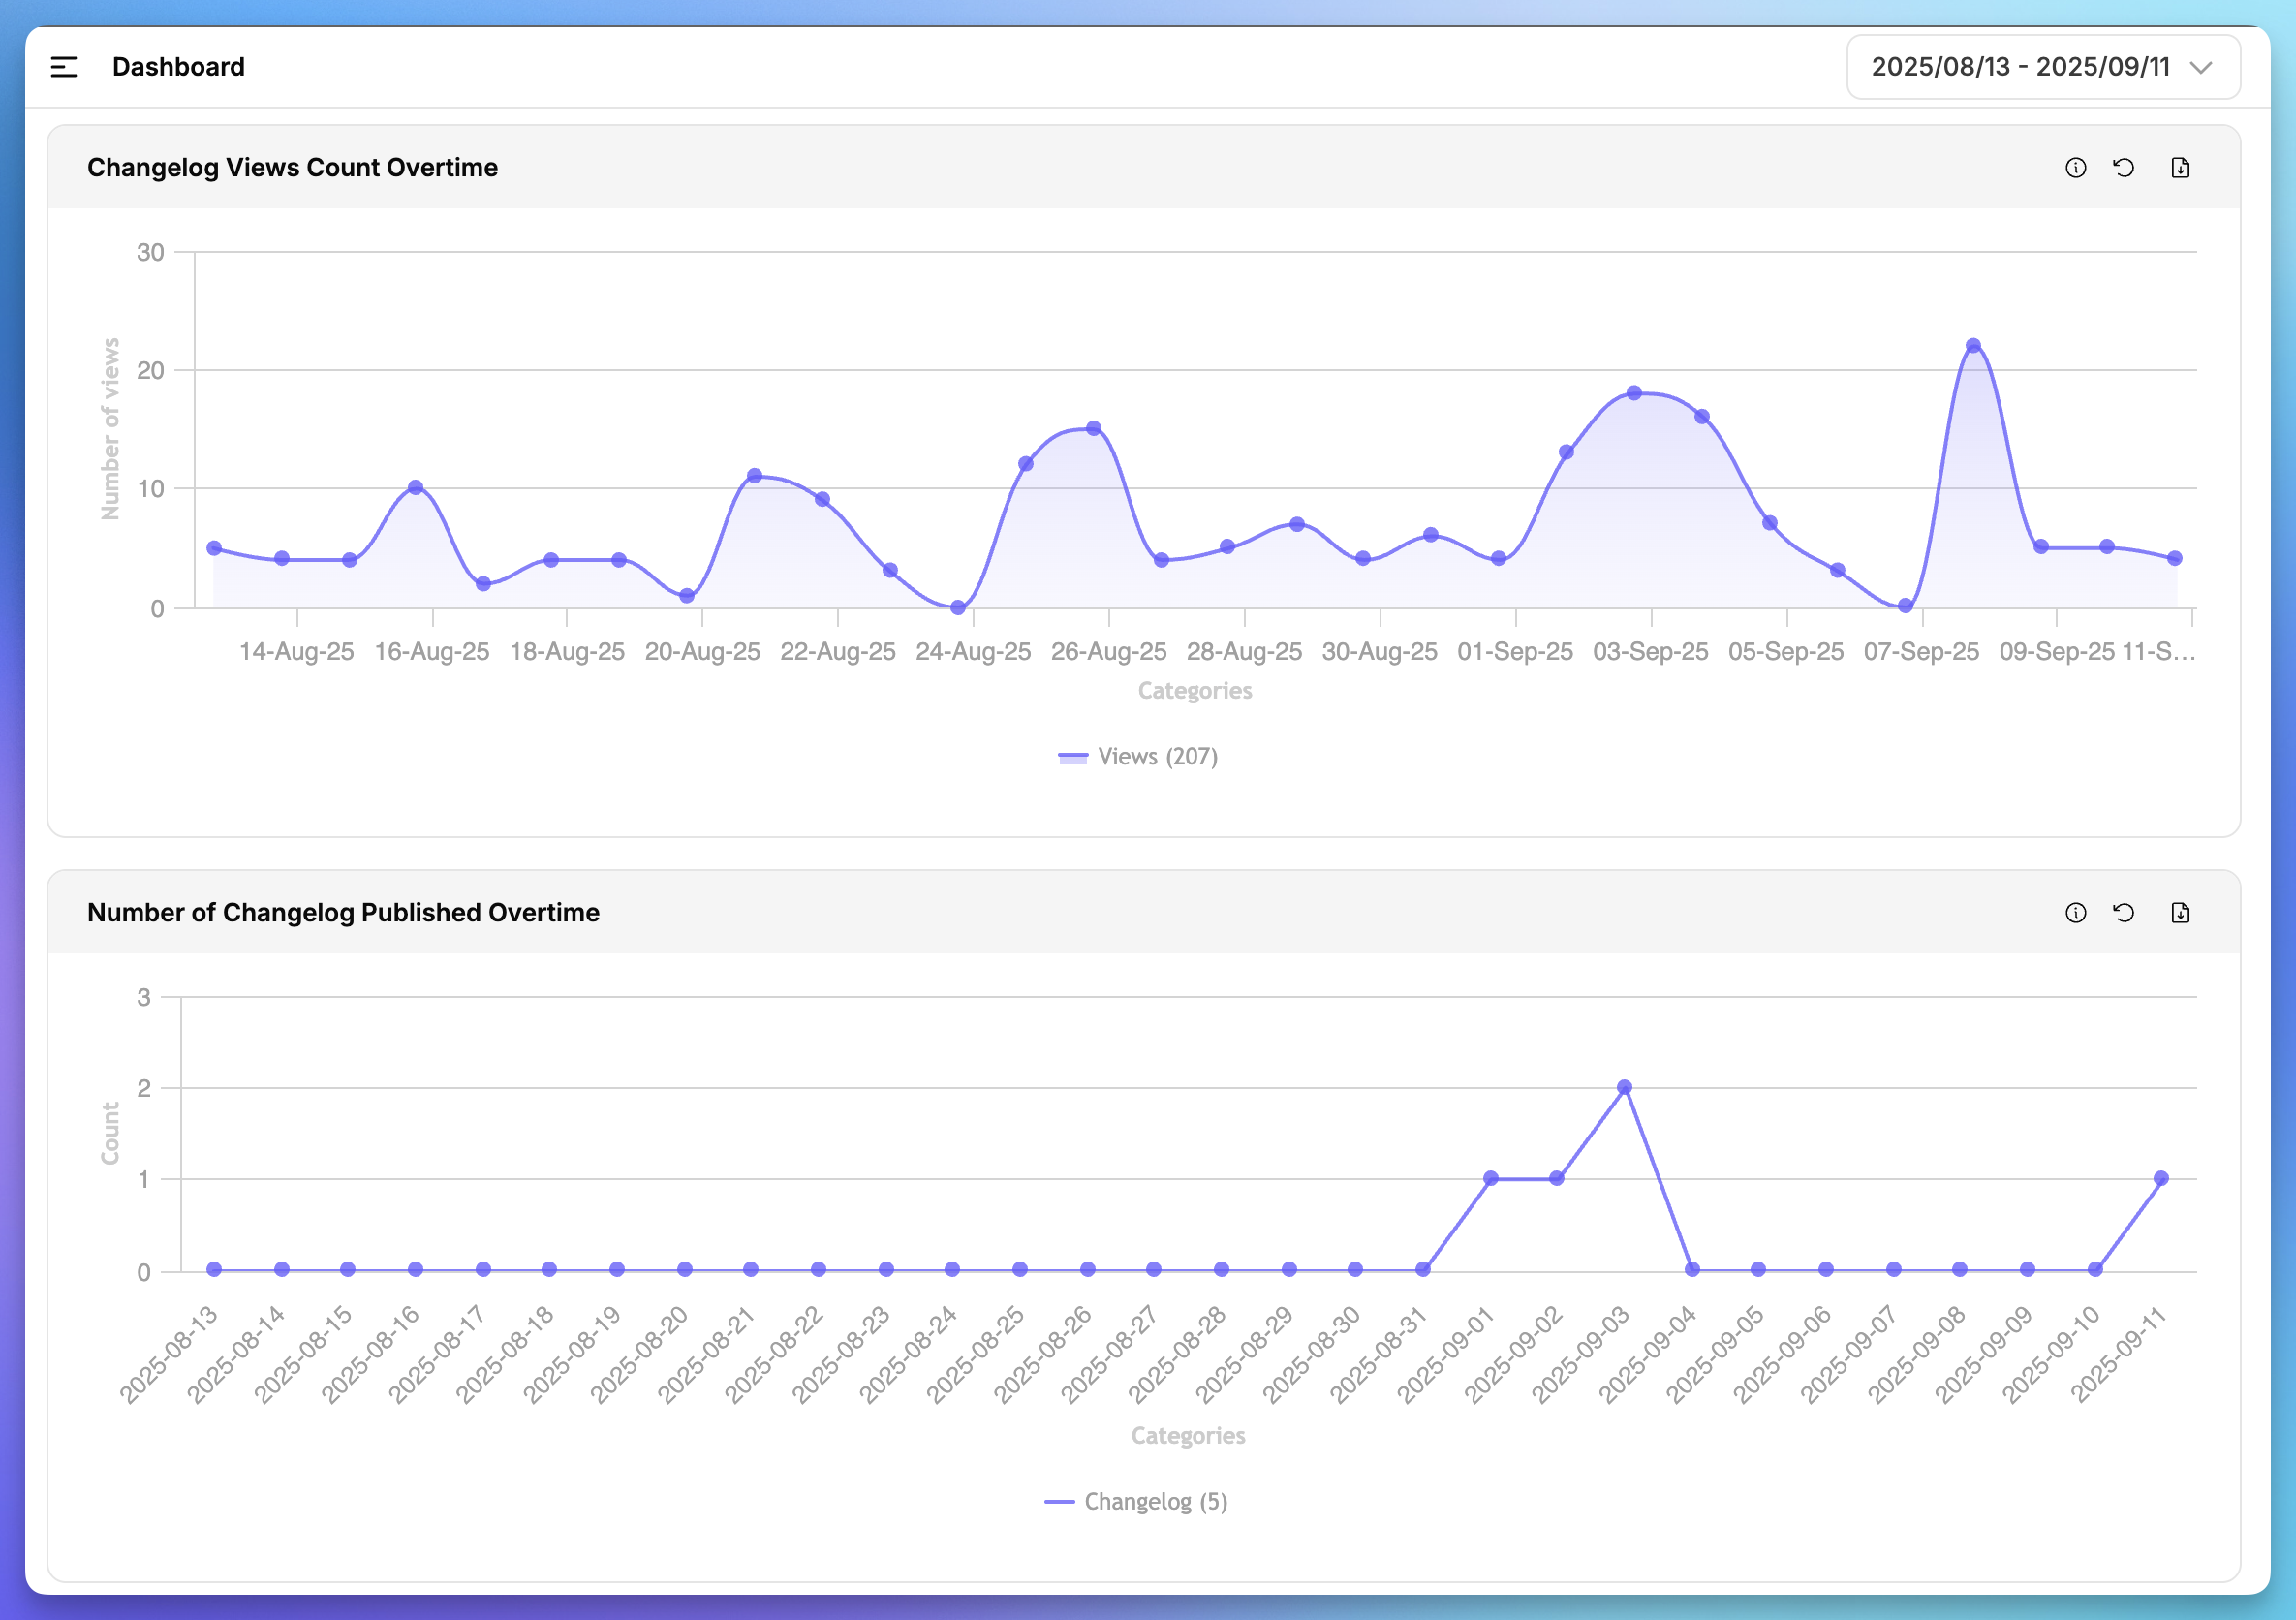
1. Views & Publishing Trends
Views Over Time: Track how many times your changelog has been viewed within the selected period.
Posts Published Over Time: Understand your release cadence and how consistently updates are shared
2. Engagement Insights
Top Changelog Views: See which updates got the most attention.
Top Visitors: Identify your most engaged readers.
Guest vs User Views: Compare how many readers are anonymous vs logged-in users.
Top Contributors: Find out who on your team is publishing the most updates.
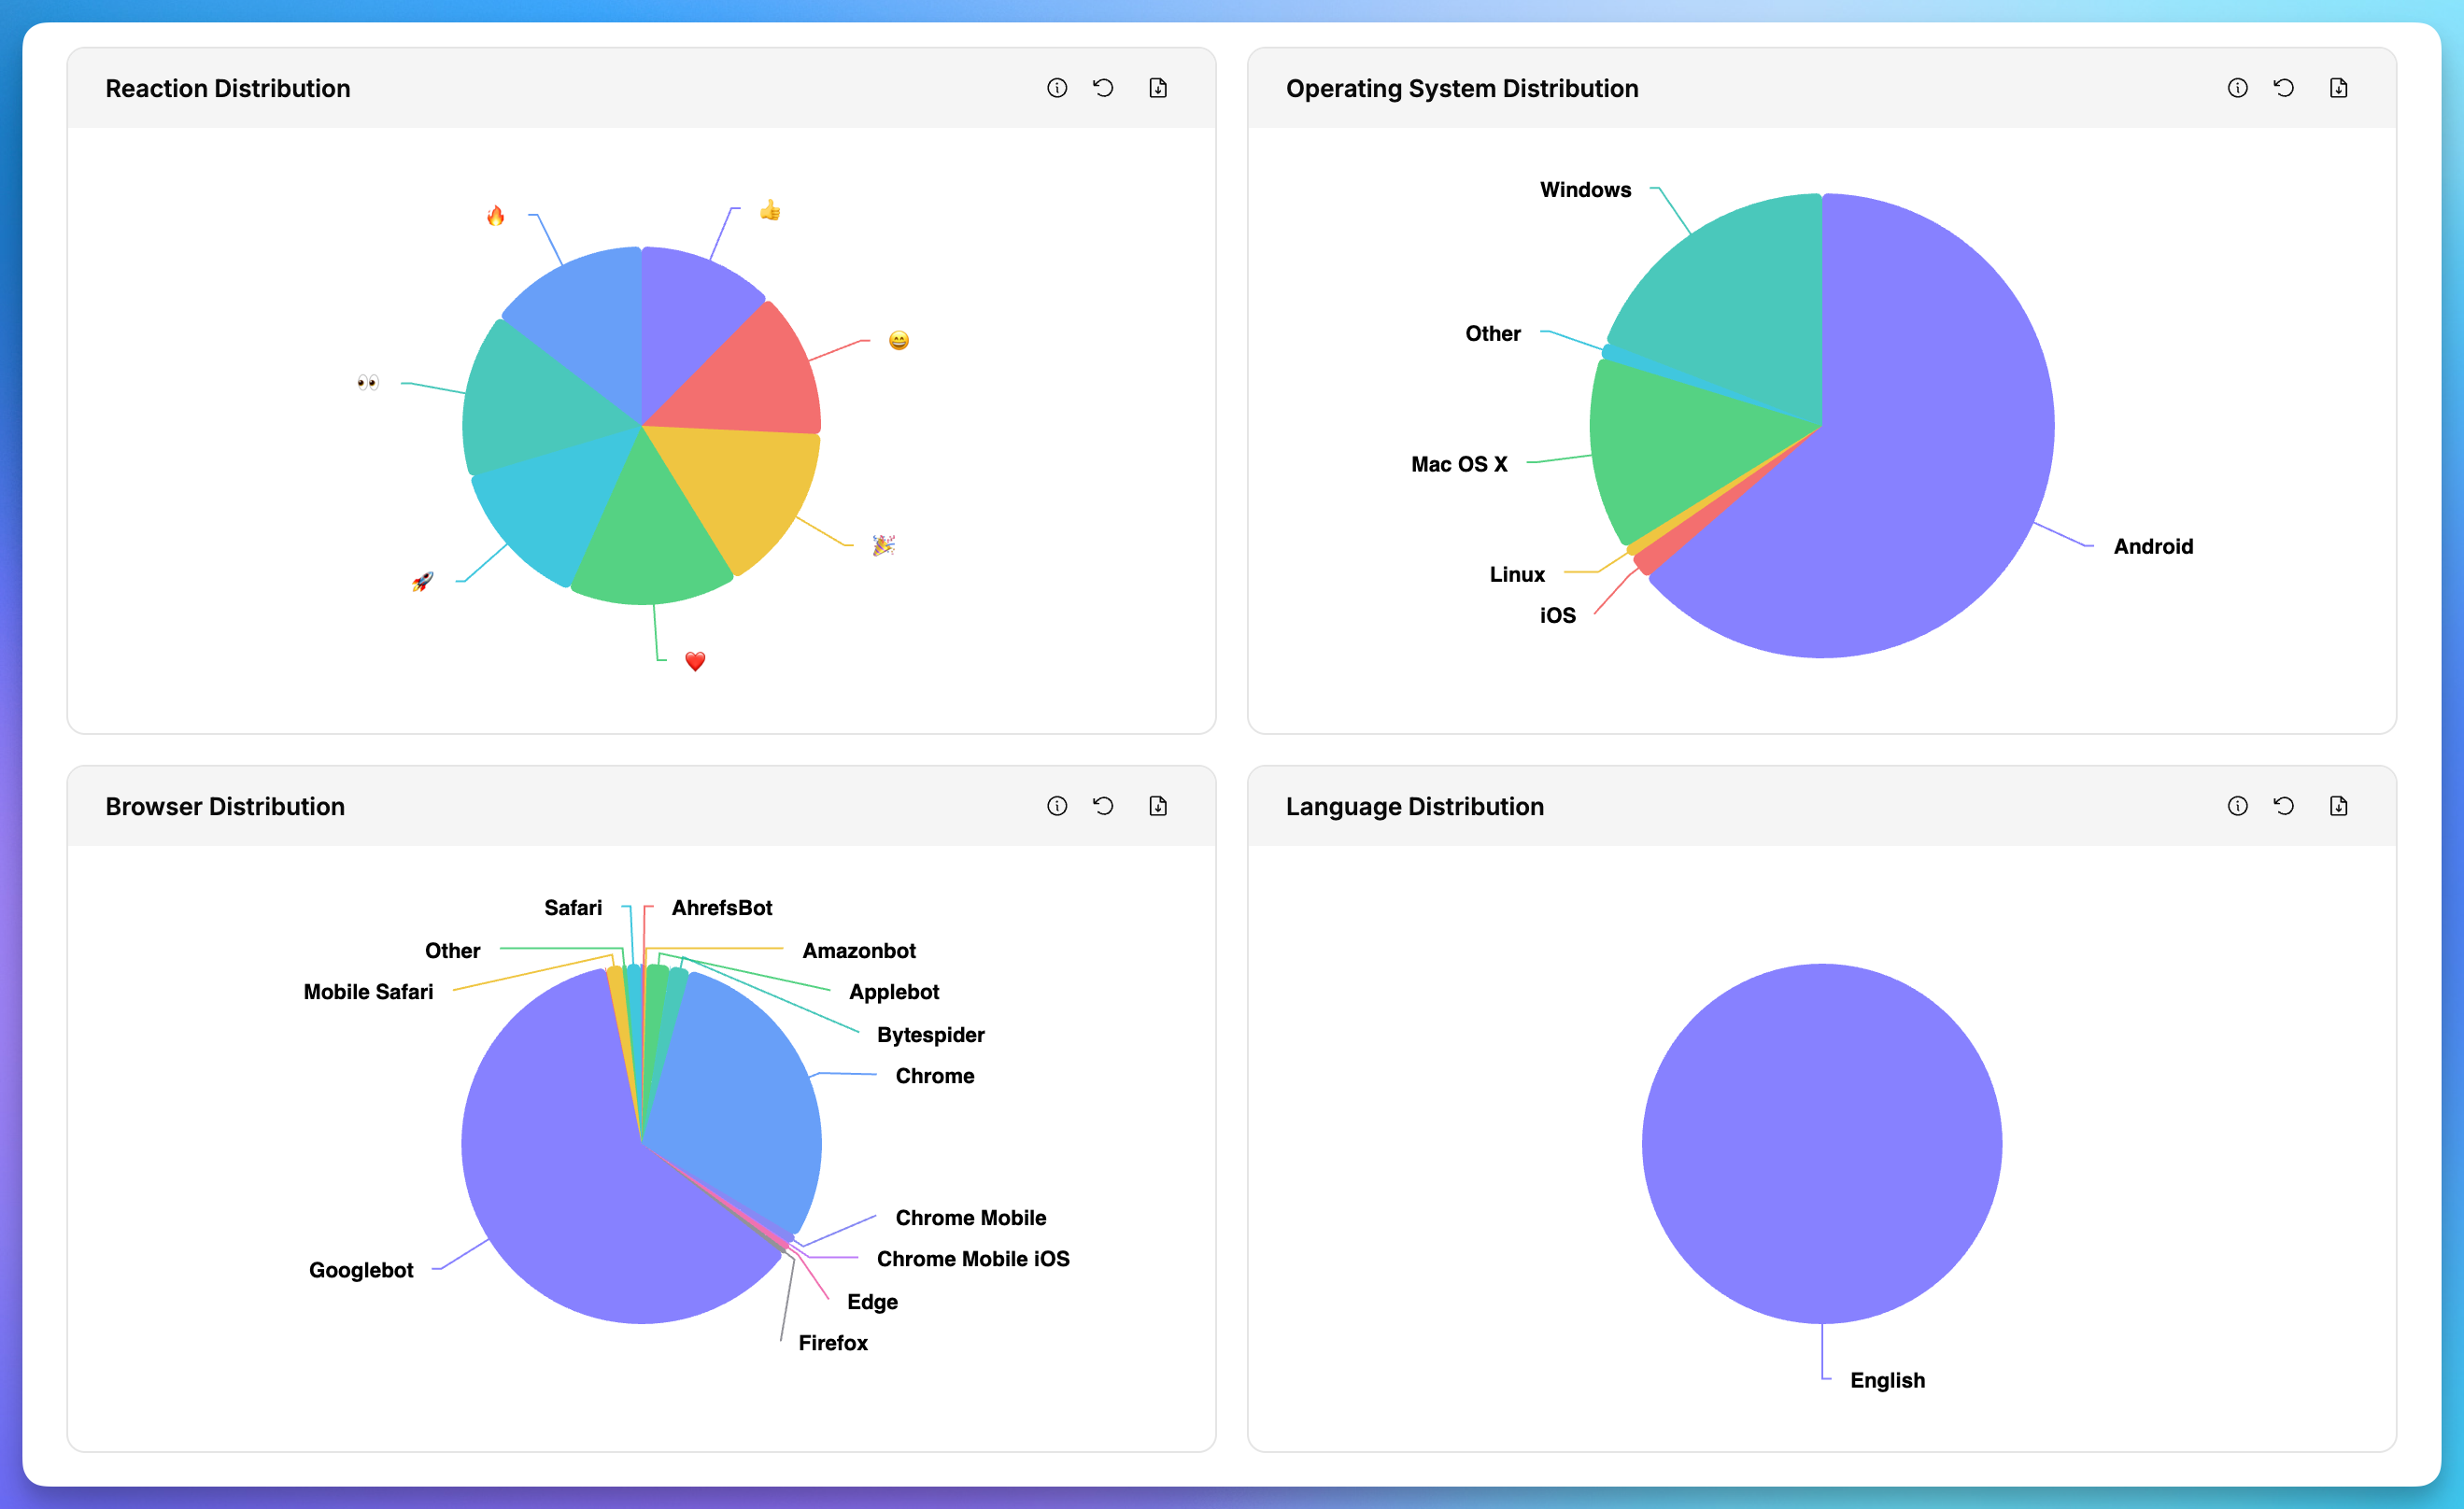
Reaction Distribution: Measure user sentiment and engagement with emoji reactions.
3. Technical Breakdown
Operating System Distribution: Learn what devices (Windows, macOS, Android, iOS, etc.) your visitors use.
Browser Distribution: See which browsers drive the most traffic.
Language Distribution: Understand the language preferences of your audience.
Why It Matters
These analytics give you a clear picture of how updates land with your users.
You’ll know what resonates, when engagement peaks, and which channels or devices your audience prefers.
Need more help?
Reach out to our support at [email protected] or submit a request on our support board! 😃
Was this helpful?